
Bradley Siderograph and Important turndates


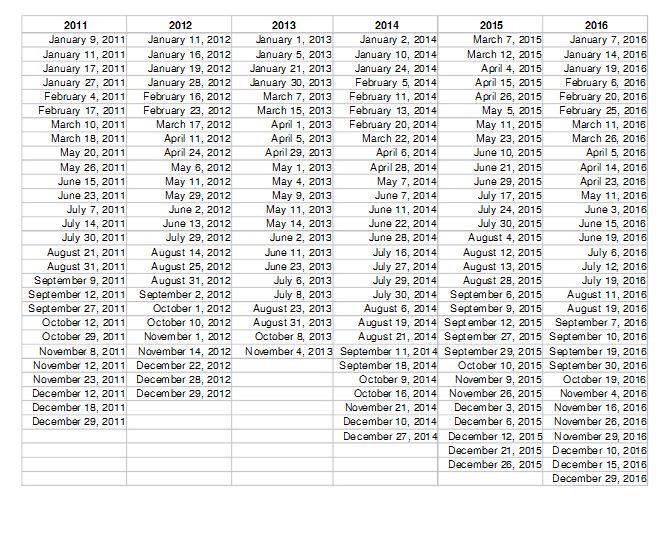
Here is 2011 and 2012 over all market look like according to Bradley Siderograph and Important turn dates for coming 5 Years

Popular posts from this blog

IWM IC

TRADE IDEA FROM MARK ==================== I wanted to offer a trade idea and get your feedback. It’s a small $1 iron condor spread on the IWM September quarterly’s, so it’s over in a relatively short time, but has a potential decent return. Although the IWM has been going up pretty strong the past two weeks (see chart below), I’m expecting a leveling out or lower rate of increase over the next 15 days which should keep it within the IC range. The credit is $.28, not a huge amount, but still decent for the risk. Remarks : Looks good to me. Range of IWM by 10/1 , I am expecting between 61 -58

Gold - Record Highs

Gold Futures Analysis - Record Highs and Investor Caution Gold Futures Analysis: Historic Highs Amid Market Uncertainty A Long Road to Record Highs Gold has always stood as a timeless symbol of value and a trusted hedge during economic instability. From ancient civilizations to modern markets, when uncertainty strikes, investors often flock to the yellow metal. In 2025, Gold futures are once again in the spotlight, reaching all-time highs, but this rally comes with critical nuances that investors must understand. A Historical Look at Gold Price Movements 1980–2002 : Gold traded in a tight consolidation range between $260 to $562 , showing little directional movement for over two decades. 2002–2011 : Gold began its breakout journey. Starting around $260 in 2002, prices surged to $1927 by 2011. 📈 ~641% increase in under a decade. 2011–2016 : A significant correction occurred, dragging prices down to $1061 . ...

Inside the 2026 Market Cycle: Volatility, Opportunity, and Trend Reversal

Market Outlook – Cycle Modeling, Analog Analysis & Trading Playbook 2026 Market Outlook: - A Cycle-Based Framework for the Coming Inflection Year By FazDane Analytics – Gann Cycles • SPX Analog Modeling • Macro Liquidity Signals Introduction Financial markets rarely move randomly. Beneath the volatility and narrative noise, long-term structural cycles tend to repeat in surprisingly consistent patterns. Using W.D. Gann’s time-cycle matrix, liquidity-driven analogs, and historical SPX behavior, 2026 emerges as one of the most important inflection years of the decade. The Gann row containing 2026 links directly to some of the most consequential years in market history: 1913 → 1932 → 1950 → 1969 → 1987 → 2006 → 2008 → 2026 These years include major tops, bottoms, crashes, liquidity contractions, and generational turning points. Together they form the backbone of the 2026 Analog SPX Model , a statistically meaningful roadmap for how markets may behave thro...